Where Tanzania’s Cashews, Coffee, and Cloves Actually Go: A Buyer-Concentration Analysis
Published 28 September 2026 · Commodities.tz Editorial
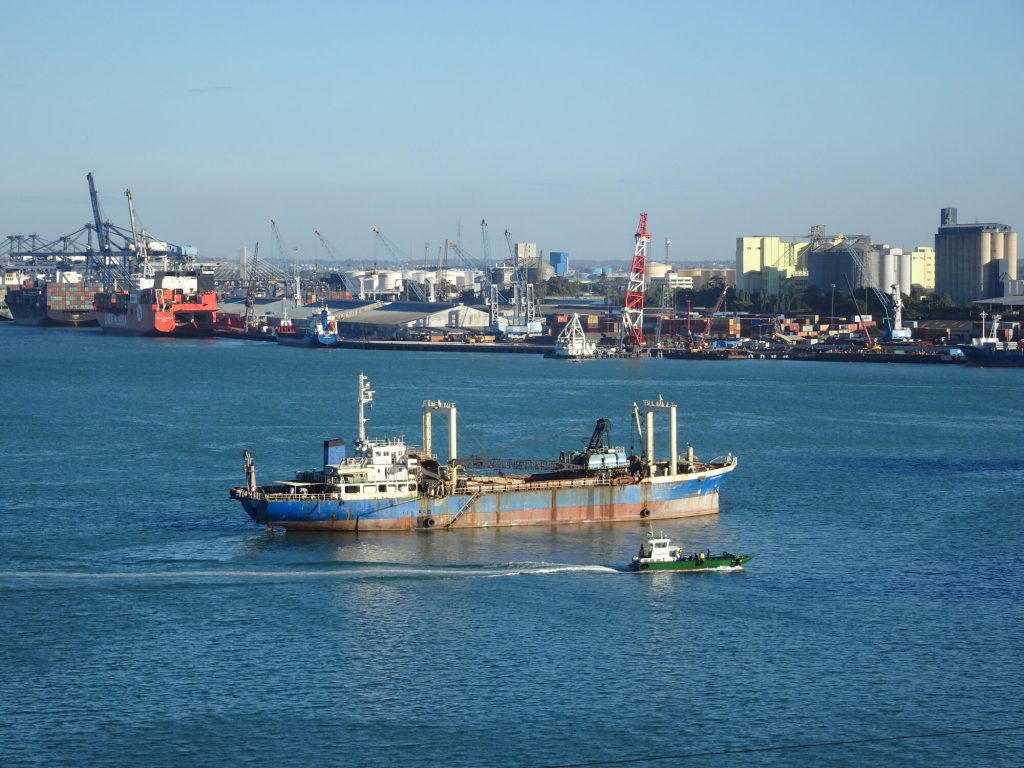
The concentration nobody talks about
Tanzania’s commodity sites cover how cashews are graded, how coffee is washed, how cloves are dried. None of them answer the question a buyer, a policymaker, or a trader actually needs answered first: where does the crop go once it leaves the port? The answer, for three of the country’s largest agricultural exports, is that it goes to a strikingly small number of countries — and in cashew’s case, to two countries almost exclusively.
This is UN Comtrade mirror data reported by Tanzania to the United Nations trade statistics database, cross-checked against Tanzania Coffee Board figures reported in Tanzanian press and Bank of Tanzania economic reviews. Where the two disagree, that disagreement is itself informative and is flagged below rather than smoothed over.
Cashew: two buyers, one raw commodity
Observed fact. In 2023, Tanzania exported 219,602 tonnes of in-shell raw cashew nuts (HS 080131) worth $206.4 million, according to Tanzania’s own customs declarations as compiled in UN Comtrade. Of that:
- India took 134,465 tonnes ($127.8 million) — 61.2% of volume, 61.9% of value.
- Vietnam took 84,245 tonnes ($77.5 million) — 38.4% of volume, 37.6% of value.
Add those two together and you get 99.6% of Tanzania’s entire raw cashew export volume for the year. Every other destination on earth — China, the Netherlands, Kenya, Bangladesh, the Gulf — split the remaining 0.4%, roughly 890 tonnes.
This is not a one-year fluke, but the split between the two buyers does swing hard. In 2022, Vietnam was actually the larger buyer: 114,712 tonnes (49.4% of that year’s 231,979-tonne total) against India’s 100,674 tonnes (43.4%). The two-country total was 92.9% in 2022 versus 99.6% in 2023 — still near-total concentration, but the lead buyer flipped.
| Year | India — volume | India — share | Vietnam — volume | Vietnam — share | Combined share |
|---|---|---|---|---|---|
| 2022 | 100,674 t | 43.4% | 114,712 t | 49.4% | 92.9% |
| 2023 | 134,465 t | 61.2% | 84,245 t | 38.4% | 99.6% |
Source: UN Comtrade, reporter Tanzania (834), HS 080131, export flow, mirror data retrieved directly from the Comtrade API.
Interpretation. This concentration is structural, not incidental. Both India and Vietnam import Tanzanian raw cashew nuts because they have the shelling and peeling capacity Tanzania mostly lacks domestically — Cashewnut Board of Tanzania figures put 2024/25 raw production at 528,260 tonnes, and industry reporting consistently puts roughly 85-90% of the national crop exported unprocessed. The two countries are competing processors buying the same raw input, which is why the split between them swings from year to year: it tracks each country’s domestic processing capacity, currency movements, and competing raw-material supply from West Africa (Côte d’Ivoire, Nigeria) and East Africa (Mozambique, Kenya) more than it tracks anything happening in Tanzania. A buyer negotiating against “the Tanzania cashew market” is, in practice, negotiating against two processing industries in two countries, not a diversified global demand base.
Coffee: a more genuinely diversified crop — but the data sources don’t fully agree
Observed fact (Tanzania Coffee Board, 2022/23 season). Tanzania Coffee Board Director General Primus Kimaryo, cited in Tanzanian press, gave a season-level destination breakdown for the 82,491 tonnes of coffee exported that season (worth $235.6 million): Japan 29%, Italy 13%, Germany 13%, Belgium 8%, USA 5%, Morocco 5%, South Africa 3%, with Sweden, Russia, Spain and Israel at 2% each and the remainder scattered across a long tail of smaller buyers.
Observed fact (UN Comtrade, calendar year 2023). Tanzania’s own reported exports of HS 090111 (green coffee, not roasted, not decaffeinated) totalled 83,798 tonnes worth $226.8 million in calendar 2023 — a total that lines up closely with TCB’s season figure. The partner breakdown, however, only partly matches:
| Destination | Comtrade 2023 volume | Comtrade value share | TCB 2022/23 season share |
|---|---|---|---|
| Italy | 15,996 t | 13.8% | 13% |
| Germany | 9,381 t | 12.7% | 13% |
| Japan | 9,977 t | 16.0% | 29% |
Sources: UN Comtrade, reporter Tanzania (834), HS 090111, export flow; Tanzania Coffee Board season figures as reported by Daily News (Tanzania).
Interpretation — the gap is real and worth flagging, not hiding. Italy and Germany match closely across both data sources. Japan does not: Comtrade’s customs-declared value share (16%) is roughly half of TCB’s season figure (29%), and the absolute Comtrade tonnage to Japan (9,977 t in 2023, 10,366 t in 2022) never approaches TCB’s implied ~15,900 tonnes. Three plausible, non-exclusive explanations: TCB’s figure is a marketing-year (July–June) tally that doesn’t map cleanly onto Comtrade’s calendar year; TCB may be counting coffee sold at auction to exporters who then route it to Japan through intermediary buyers, attributing it to final consumption rather than the customs-declared first destination; or a portion of Tanzania’s Japan-bound coffee transits through a third country before final import, which would show up in Comtrade under that transit country rather than Japan. Whichever explanation is correct, the practical lesson for anyone using this data is the same: government-agency “who buys our crop” percentages and UN customs-mirror data are not automatically the same number, and coffee — unlike cashew — routes through multiple intermediaries in a way that makes “final destination” genuinely ambiguous. Treat TCB’s Japan figure as the buyer-relationship story (who Tanzania’s exporters deal with) and Comtrade’s figure as the customs-declared shipment story; they are both real, and they are measuring slightly different things.
What both sources agree on: Tanzania’s coffee market is materially more diversified than its cashew market. No single country comes close to cashew-style 60%+ dominance, and the buyer base spans East Asia, the EU, and — per TCB’s list — a genuine long tail from Morocco to Israel.
Cloves: India and a Singapore trading hub, not “India, Singapore, Indonesia” as three equal end markets
Observed fact. Tanzania (reporting for Zanzibar, whose clove exports are recorded under the national Comtrade total) exported 4,691 tonnes of cloves (HS 0907) worth $25.1 million in calendar 2023. The destination breakdown:
| Destination | Volume | Value | Volume share | Value share |
|---|---|---|---|---|
| India | 2,405 t | $9.10m | 51.3% | 36.2% |
| Singapore | 1,562 t | $12.58m | 33.3% | 50.1% |
| Indonesia (direct) | 125 t | $0.90m | 2.7% | 3.6% |
| All other destinations | ~600 t | ~$2.5m | ~12.7% | ~10.1% |
Source: UN Comtrade, reporter Tanzania (834), HS 0907, export flow, calendar year 2023.
Interpretation. India and Singapore together take roughly 85% of Tanzania’s clove exports by volume and 86% by value — but this is not the “India, Singapore, Indonesia as three parallel buyers” picture that general trade commentary often repeats. Direct exports to Indonesia — historically one of the world’s largest clove consumers, mainly for kretek cigarette manufacturing — are small (2.7% of volume) in this data. Singapore’s outsized value share (50% of value from 33% of volume — a materially higher unit price than the India-bound tonnage) is the signature of a trading and re-export hub rather than a final consumer market: high-value, well-sorted lots get consolidated and traded through Singapore before moving on to Indonesia, the Middle East, or Europe. The Comtrade “destination” field records the first reported partner country, not the eventual end-consumer, so anyone reading “Singapore” as a clove-consuming market is being misled by the data structure itself. The commercially useful takeaway is narrower and more honest: verified direct buyers are concentrated in India and a Singapore-based trading channel; Indonesia’s real exposure to Zanzibar cloves is very likely larger than 2.7% once re-exports are traced, but that figure cannot be verified from this dataset alone.
Separately, Zanzibar’s clove trade has been extraordinarily volatile on price and volume even in years immediately following 2023: Bank of Tanzania and Zanzibar trade reporting put clove export volume at roughly 700 tonnes in one recent year and 6,400-7,000 tonnes with an average price above $6,300/tonne the following year, a more-than-ninefold volume swing that dwarfs the destination-mix question in its effect on Zanzibar’s total export earnings. Cloves went from a minor line item to reportedly 63% of Zanzibar’s total goods exports in the space of one year on a global supply shortfall (largely a production shortfall in competing origins) that pushed prices up sharply. Destination concentration matters, but for cloves specifically, year-to-year supply and price swings currently matter more.
What this means for anyone selling into these markets
The three commodities sit on a real spectrum of buyer concentration, not a uniform “Tanzania exports raw, unprocessed commodities” story:
- Cashew is the most concentrated: two buyers, occasionally over 99% of volume between them. A price or policy shock in either India’s or Vietnam’s processing sector — an import tariff change, a currency move, a competing-origin harvest — moves the entire Tanzanian raw cashew market, because there is effectively no third buyer of scale to absorb displaced volume.
- Coffee is genuinely more diversified — EU markets, Japan, and a long tail of smaller buyers — but the buyer relationship (who trades it) and the customs-declared destination (where it clears first) diverge enough that either data source alone will mislead a reader trying to understand who actually consumes Tanzanian coffee.
- Cloves look concentrated in India and Singapore, but Singapore’s number is a trading-hub artifact rather than a consumption figure — the real end-market picture (almost certainly including a larger Indonesian share via re-export) is not fully visible in bilateral trade-flow data at all.
None of this is available on the sibling commodity portals in this network, which — as of this review — focus on grading, harvest calendars, auction mechanics and processing, not on where the crop is actually consumed once it leaves a Tanzanian port. That is the gap this analysis is intended to fill, using primary trade-flow data rather than the secondhand “mainly sold to India and Vietnam” framing that circulates without the underlying numbers attached.
Methodology note
All UN Comtrade figures above were retrieved directly from the Comtrade public API for reporter Tanzania (numeric code 834), export flow, using HS codes 080131 (cashew nuts, in shell), 090111 (coffee, not roasted, not decaffeinated) and 0907 (cloves, whole and stems), for calendar years 2022 and 2023 — the most recent years with complete Tanzania-reported mirror data available at time of writing. Comtrade country-of-destination fields record the first declared partner country on the export customs document, which is not always the same as the country where a commodity is finally consumed or processed — a limitation discussed explicitly above for both coffee (Japan) and cloves (Singapore). Tanzania Coffee Board and Bank of Tanzania figures are drawn from their reported season and fiscal-year statistics as covered in Tanzanian press, not from primary board publications directly retrieved, and are labeled as such above.
- UN Comtrade — Tanzania (reporter 834) export data, HS 080131/090111/0907, 2022-2023 — https://comtradeapi.un.org/public/v1/preview/C/A/HS — accessed 2026-09-27
- Daily News (Tanzania) — "Japan, Italy lead in consuming TZ coffee" — https://dailynews.co.tz/japan-italy-lead-in-consuming-tz-coffee/ — accessed 2026-09-27
- Daily News (Tanzania) — "Zanzibar export boom masks clove concentration" — https://dailynews.co.tz/zanzibar-export-boom-masks-clove-concentration/ — accessed 2026-09-27
- Cashewnut Board of Tanzania / TanzaniaInvest — cashew production and auction-sales figures, 2024/25 season — https://www.tanzaniainvest.com/cashew — accessed 2026-09-27